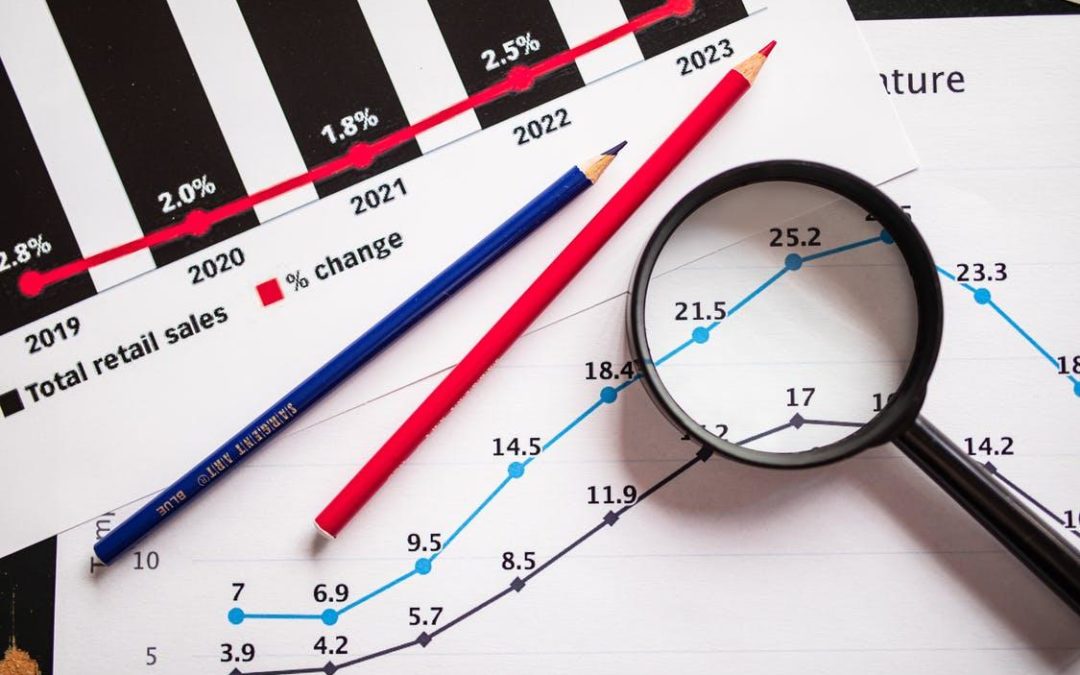
Performance is a top area of focus for your business. You can get a high-level view of your business’s performance by using a scorecard that displays both your target key performance indicators (KPIs). KPIs provide insight into how well your business is meeting its objectives and whether it’s growing.
The assumption behind KPIs is that current conditions can help predict future growth and influence trends. Lagging indicators assess the current conditions, whereas leading indicators predict future growth. Together, these indicators help you develop accurate projections. This article discusses the difference between leading and lagging indicators, as well as their uses.
Leading Indicators
Leading indicators can be viewed as inputs because they determine actions required to achieve measurable outcomes. Leading, in this case, refers to the role these indicators play in steering your business toward meeting its objectives. Consequently, some of the questions that emerge when assessing leading indicators include:
- What steps can the business take to its supply chain management?
- What skills can managers improve to improve employee satisfaction?
- What resources does the marketing department need to achieve its objectives?
Leading indicators define benchmarks that, when met, suggest that your business is meeting its overall objectives and KPIs. For example, the leading indicators for an e-commerce company might be:
- Subscribes per unique visitor/channel/page/device
- Sales by traffic referrer
- Number of purchases in the past six months
Remember, these figures would indicate the metrics the business needs to meet to achieve specific objectives.
Lagging Indicators
Lagging indicators are comparable to outputs. They differ from leading indicators in two important ways:
- Leading indicators tell you how to achieve a desired level of performance, whereas lagging indicators show you how well you’re currently performing.
- Leading indicators are easy to change but hard to measure, whereas lagging indicators are easy to measure but unchangeable.
The assessment of lagging indicators involves asking questions such as:
- How many people subscribed to a service?
- How much many units did the production line output?
- What size of audience did the marketing department reach?
Lagging indicators draw insights into future growth by measuring output that’s already occurred. These measurements include:
- Revenue
- Customer participation
- Renewal rates
- Profit
- Expenses
Using Leading and Lagging Indicators
Lagging indicators are easier to understand intuitively because they’re triggered only by events in the immediate past. For example, suppose you’ve just released a product or held an event. You’ll measure the outcome using lagging indicators like how well the product was received or how many people attended the event.
In contrast, leading indicators are usually abstract. They serve as a map to help your business get to where you want it to go. For example, leading indicators can help you determine the potential of exploring new markets. They answer questions about future success and growth, something lagging indicators can’t do.
For these reasons, lagging indicators work best when used alongside leading indicators to compare projections and outcomes. Software tools such as Power BI make it easy to analyze both indicators and gain invaluable insights.
Accurately Project and Track Your Business’s Performance
Both leading and lagging indicators are essential to developing an accurate scorecard that gives you the full picture of how well you’re meeting your KPIs. Visit Turtle Works to learn more about using Power BI to define and track effective leading and lagging indicators for your business.

